Community Corner
St. Croix River Water Level at 685.99 Feet and Receding; First Street Reopened
A live video stream of the flood at First and Buckeye streets in Hudson is available at http://patch.com/buTux.
Editor's note: This is no longer the most recent post.
----
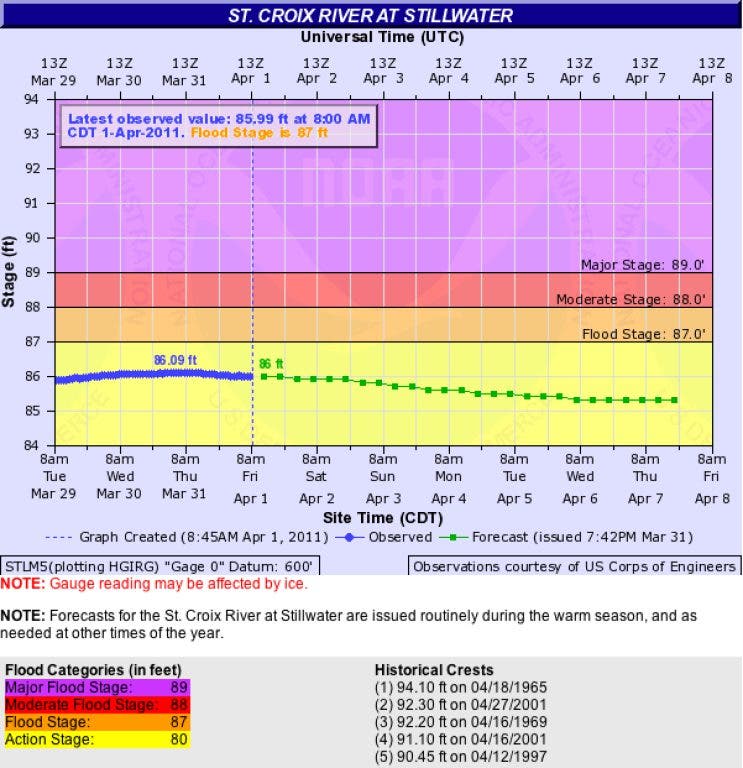
As of 8 a.m. on Friday, April 1, 2011, the St. Croix River water level was receding at 685.99 feet in Stillwater, MN. The river reached its highest level, or crest, at 686.09 feet on Thursday morning. Some reports call for a second crest at some point in April.
Find out what's happening in Hudsonwith free, real-time updates from Patch.
City workers today reopened First Street between Buckeye and Wisconsin streets. On Wednesday, the city because of the rising flood waters. Businesses in the Riverfront Square building on Buckeye Street (, and ) were been affected and remained open. Portions of Front Street have been under water all week.
The area remains under a flood warning and Hudson Mayor Alan Burchill has declared a flood emergency in Hudson. See a live video stream of the flood at First and Buckeye streets in Hudson by going to http://patch.com/buTux.
Find out what's happening in Hudsonwith free, real-time updates from Patch.
About the water levels
The average water level in Hudson is 675 feet. The following are elevations (in feet) of various areas in Hudson that are prone to flooding, according to the city's flood work plan:
- Seawall at Lakefront Park: 680
- Second tier at Lakefront Park: 684
- Lowest elevation of Front Street: 684.9
- First Street (between Buckeye Street and Commercial Street): 685.8
- Floor of Buckeye Street Garage: 686.75
- Top of Lake Mallalieu dam gates: 688.3
- Slab elevation at Lakefront Park bathhouse: 690
- Top of Dike Road: 691
- Abandoned railroad bed north of Vine Street to St. Croix Street: 692
Hudson flood history
The highest flood elevations (in feet) in Hudson history are the following, according to the city:
- 694.1 in 1965
- 692.3 in 2001
- 692.2 in 1969
- 690.45 in 1997
- 689.7 in 1952
- 687.9 in 1993
- 687.5 in 1986
- 687.3 in 1975
- 685.93 in 2010
----
Editor's Note: The statistics and forecasts from this article come from theAdvanced Hydrologic Prediction Service provided by the National Oceanic and Atmospheric Administration's National Weather Service (NOAA-NWS).